Who doesn't like a good picture over a thousand words?
An infographic is just a pictorial representation of some data - maybe a graph, or chart, or some other kind of short, single-page, at-a-glance presentation on some subject. I like the ones that are taller than they are wide, and present material as a sort of short story.
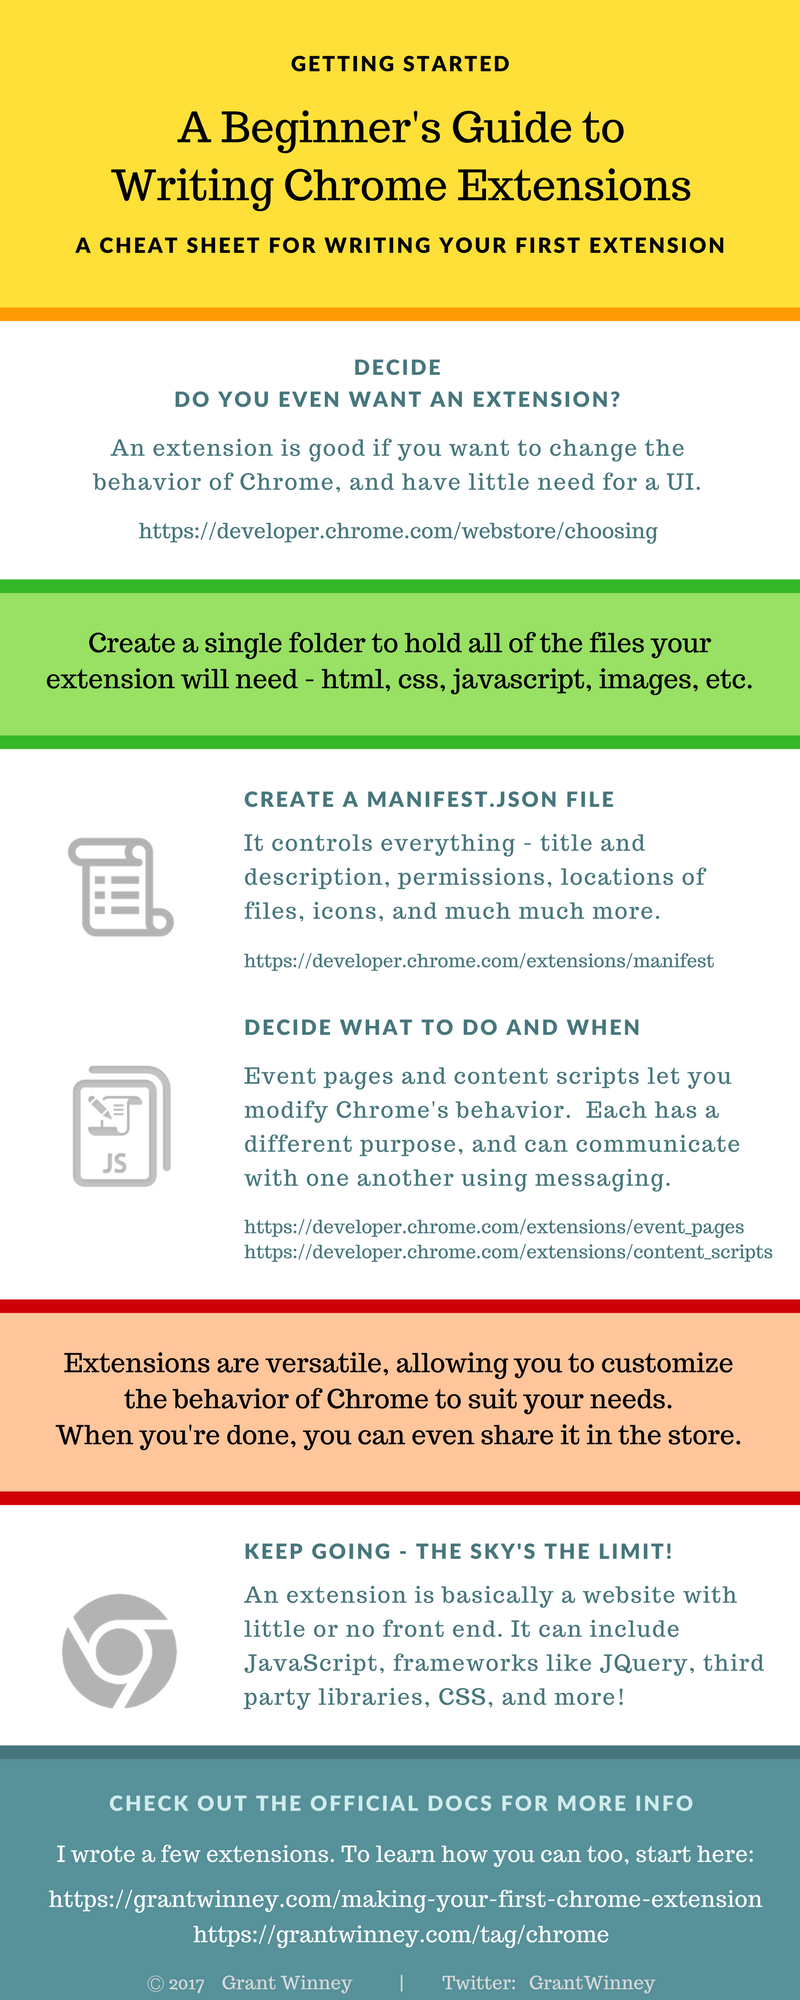
I figured I've done enough with Chrome extensions at this point that maybe I could try my hand at creating one. You can see it below, or check it out on Canva. There's also a pdf version that has active hyperlinks. I stuck with the Google color scheme since mine's related to Chrome.
You can create your own too - just look for the "infographic" template if you want one that looks like this. I use Canva to create header images for some of my blog posts, but also for other things like invitations to my kids' parties. It's a great site. You can upload your own clipart, save and share images, etc... check them out.